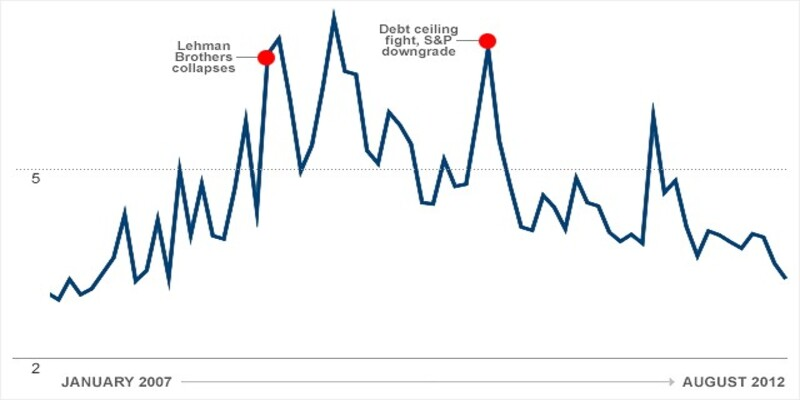
The Volume of trades in a given time frame is a crucial indicator of market activity in the financial sector. Market sentiment and investor behavior can be gleaned from the Volume of trades because they reflect the total activity of the market. It is a fundamental part of technical analysis, which traders employ to spot patterns in the market and interpret them as potential opportunities. This article will define trading volume, discuss its significance, and define how it is calculated. We will also go through the various forms of trading volume, the variables that influence trading volume, and the practical applications of trading volume in the financial sector.
The Concept Of Trading Volume
The total number of shares or contracts traded during a given time frame is known as trading volume, trading activity, or Volume. One of the most critical measurements in the financial world, it is most commonly taken daily, weekly, or monthly. The total number of shares bought and sold over a specified period is known as trading volume, a key measure of market activity. Market liquidity, the ease with which securities can be purchased and sold without significantly impacting their price, is evaluated using this metric. Markets with higher trade volumes are more active and liquid than those with lower volumes.
How Do You Keep Track Of Trading Volume?
The total number of shares or contracts that have changed hands during a given time frame is considered the trading volume for that time frame. Several strategies exist for this, depending on the nature of the market and the traded security. Total trading volume is determined by multiplying the number of shares traded by the price per share in the stock market. Take a stock that trades at $50 per share. For example, the total trading volume would be $5,000,000. Options contracts are the basic unit of accountancy in the options market, and total trading volume is determined by multiplying the number of contracts exchanged by the contract size. If 1,000 options contracts are exchanged, each for 100 shares, the total amount of shares traded would be 100,000.
Various Trading Volumes:

Several different measures of trade volume are employed in the financial sector, including:
- The total number of shares or contracts changed over a given time frame, such as a day, week, or month.
- To calculate the VWAP, consider the total dollar volume of trades for the period rather than just the Volume at each price point.
- As a technical indicator, On-Balance Volume (OBV) looks at the Volume of trades to foretell where stock prices will go. On-balance-volume (OBV) is arrived at by adding the total Volume of shares traded on days when the stock price goes up and subtracting the total Volume of shares traded on days when the stock price goes down.
- Relative Volume measures how recent trade activity compares to the norm for a certain time frame. A more active and liquid market should have a larger relative volume.
Trading Volume And Its Influencing Factors:
Trading volume can be affected by several things.
- Investor and trader sentiment, or how people feel about the market as a whole, can majorly affect market activity. Optimism can pave the way to
- increased trading activity, while a decrease in trading activity can result from negative sentiment.
- Trade volumes can be affected by changes in economic variables like GDP, inflation, and interest rates. Trading volumes may increase in response to optimistic financial data or decrease in pessimistic ones.
- Trading Volumes may be Affected by News and Events Such as Corporate Earnings Reports, Political Changes, and Natural Disasters. The trading activity might increase in response to noteworthy news or events or decrease in response to unexpected or unpleasant news.
- Increased market volatility might lead to more transactions as participants attempt to profit from price fluctuations.
- Regulations governing trading activity can impact the Volume of trading activity. Limits on short selling or leverage trading are two examples of measures that regulators have used to control trade volumes.
Applications Of Trade Volume:

The Volume of trades executed is a key indicator in technical analysis since it helps traders spot patterns and indications in the market. Market liquidity analysis is another use, and it is crucial in establishing how simple it is to buy and sell shares.
Investor sentiment and trading activity can be gauged from the Volume of trades. Markets with higher trading volumes are typically more active and liquid than those with lower volumes. Investor optimism, willingness to take risks and general market attitude are all things that may be gleaned from this.
At last, the Volume of trades is analyzed to determine how well an investment or security has performed. An increase in trade volume may lead to a rise in price because it indicates rising demand and market interest. Conversely, fewer trading volumes may lead to lower prices because they reflect weaker demand and interest.
Conclusion
The Volume of trades in a given time frame is a crucial indicator of market activity in the financial sector. The Volume of trading in a market is a key measure of its health since it reveals the total number of shares purchased and sold during a specified time frame. The Volume of trades executed is often regarded as a key performance indicator in the financial markets, as it reveals insightful information about the actions and attitudes of investors and traders. Various kinds of trading volume are employed in the financial industry, all of which are based on the number of shares or contracts traded over a given period. Market sentiment, economic indicators, news and events, market volatility, and trading restrictions are some variables that impact trading volume.


